Would you like to react to this message? Create an account in a few clicks or log in to continue.

You are not connected. Please login or register

Adding or Removing Breakpoints (AVRasm2) may Freeze or Crash the Program

3 posters

Go down  Message [Page 1 of 1]

KerimF

KerimF

Windows 7, 32
SimulIDE-R1861_Win32

To fix bugs in the code ‘EarTest_08P_.asm’ (attached), adding and/or removing a breakpoint likely leads to freezing or crashing the program.

I noticed that, for a breakpoint to be stable, its asm file should be saved. But this doesn’t help while debugging a complex code when breakpoints may need to be added or removed while the debugger session is running.

I am afraid that since you don’t have a clear idea of the attached code, you may not reproduce this.

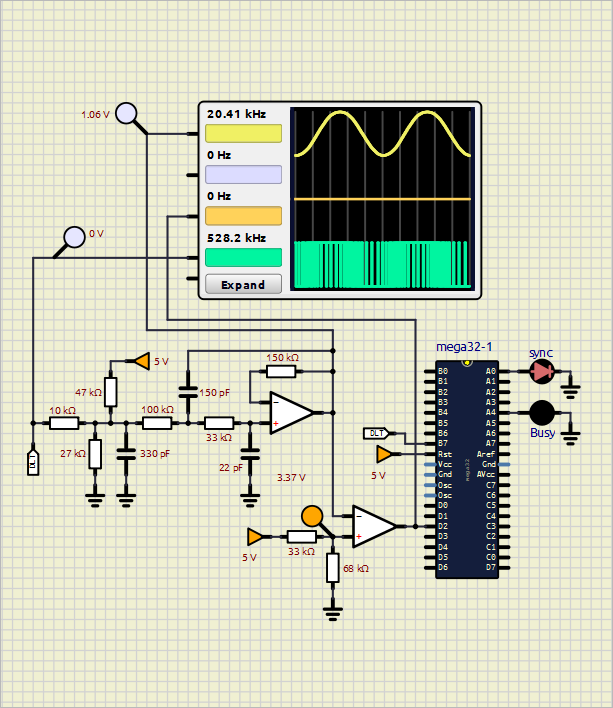
For the time being, the code is supposed to synthesis a sinewave by generating/saving a delta bit-stream table (bits are saved as bytes in SRAM, DLT_tbl: at 0x06B8, 25 bytes for 2 cycles). The delta bits are outputted at PB7 (DOwavHi:). The delta bit clock is 2 MHz (4 cycles*0.125us).
After outputting 24 cycles of sinewave, the code loop is interrupted by timer 1. The timer 1 interrupt routine decreases the ‘delta step’ (dvFd_H: dvFd_L) then another 24 cycles of sinewave are generated (for the same N bits per cycle, which is 97 bits here, 20.62 kHz, though a bug lets it be 20.41 kHz!).
By decreasing the ‘delta step’, the generated sinewave amplitude increases. The code will be interrupted by INT0 when the amplitude reaches certain amplitude (3.37 V here) in order to start a new frequency (a lower one) by incrementing N bits (97 to 98 here).
At the end of the project, the total number of frequencies will be 485 to produce 20.83 kHz down to 0.648 kHz. And by reducing the delta bit rate 32 times (2,000,000 to 62,500 Hz), the generated frequencies become from 651 Hz down to 20 Hz.

Now, I am stuck to find out the bug that lets the frequency be 20.41 kHz instead of 20.62 kHz (as if the delta N bits per cycle is 98 instead of 97).

Adding or Removing Breakpoints (AVRasm2) may Freeze or Crash the Program Eartes12
Attachments
Adding or Removing Breakpoints (AVRasm2) may Freeze or Crash the Program AttachmentEarTest_08P_.zip
You don't have permission to download attachments.
(31 Kb) Downloaded 1 times
Adding or Removing Breakpoints (AVRasm2) may Freeze or Crash the Program AttachmentEarTest_08P_lst.zip
You don't have permission to download attachments.
(43 Kb) Downloaded 1 times

royqh1979


It seems that breakpoints can't be added when debugger is running.

So I'm not sure what you have done? Maybe you should provide more infos, about the steps you done while debugging, to help reproduce the bug.

Maybe you could describe the operations/steps you've done like this:

(1) open the circuit file
(2) open asm file
(3) choose "..." compiler
(4)save asm files
(5) add breakpoint at line xxx
(6) start debugger
(7) run to the breakpoint line xxx
(Cool remove breakpoint at line xxx
etc.

KerimF

KerimF

royqh1979 wrote:It seems that breakpoints can't be added when debugger is running.

So I'm not sure what you have done? Maybe you should provide more infos, about the steps you done while debugging, to help reproduce the bug.

Maybe you could describe the operations/steps you've done like this:

(1) open the circuit file
(2) open asm file
(3) choose "..." compiler
(4)save asm files
(5) add breakpoint at line xxx
(6) start debugger
(7) run to the breakpoint line xxx
(Cool remove breakpoint at line xxx
etc.

On my side, a breakpoint could be added (and removed) while the debugger is running. But, sooner or later, the program freezes (likely enters an endless loop) or crashes when doing this. The big problem is that this doesn't happen necessarily by repeating the same steps!

For instance, due to world's regulations, I used to write my codes in assembly language only (from Z80, C51 to AVR lately). I don't have, since very long (I am 74), the privilege to download any high language advanced compiler. So, when necessary, I use an old C compiler for DOS (of Borland C 3.1 package, I bought in the 80's), to write small PC programs for in-house applications.

Thank you for your care.

royqh1979


KerimF wrote:

On my side, a breakpoint could be added (and removed) while the debugger is running. But, sooner or later, the program freezes (likely enters an endless loop) or crashes when doing this. The big problem is that this doesn't happen necessarily by repeating the same steps!

For instance, due to world's regulations, I used to write my codes in assembly language only (from Z80, C51 to AVR lately). I don't have, since very long (I am 74), the privilege to download any high language advanced compiler. So, when necessary, I use an old C compiler for DOS (of Borland C 3.1 package, I bought in the 80's), to write small PC programs for in-house applications.

Thank you for your care.

It seems that in the newest trunk revision 1867, breakpoint can't be added but can be removed while debugger running. It should be a bug.

arcachofo

arcachofo

It seems that in the newest trunk revision 1867, breakpoint can't be added but can be removed while debugger running. It should be a bug.
We should make a difference here.
You can add/remove breakpoints while the Debugger is started, but not while it's running code.
This is how it works right now, if the debugger is running you should first pause, then add a breakpoint, then resume.

adding and/or removing a breakpoint likely leads to freezing or crashing the program.
There are a few questions:
Does this happen only in Revision 1861?
Does it happen at the moment you add/remove the breakpoint?
If not, when? doing a debug step? doing a "run to next breakpoint"?

Not sure, but this could be an issue:
These C-style comments will cause problems if they are meant to disable code.
Code:
/* ; <comment for Simu_1>
; 1 sec boot delay
    RCALL DLYqSec
    RCALL DLYqSec
    RCALL DLYqSec
    RCALL DLYqSec
*/ ; <comment for Simu_1>

royqh1979


arcachofo wrote:
It seems that in the newest trunk revision 1867, breakpoint can't be added but can be removed while debugger running. It should be a bug.
We should make a difference here.
You can add/remove breakpoints while the Debugger is started, but not while it's running code.
This is how it works right now, if the debugger is running you should first pause, then add a breakpoint, then resume.

codeeditor::addBreakpoint() has a debugger status check, but remBreakpoint() dosen't.
I think it should be a bug.

KerimF

KerimF

To find the frequency bug, I used SimulIDE_1.0.1-R1386_Win32 (obsolete version). Although it is not perfect about the breakpoints, it doesn’t crash when adding or removing them. With this obsolete version I was able to find a serious bug at the entry of the sinewave loop (a few lines after 'last step'). But the scope keeps displaying 20.41 kHz instead of 20.62 kHz.

In order to find the origin of this discrepancy, I also run the fixed code (EarTest_08P1.asm, attached) by using SimulIDE-R1861_Win32. But before running it, I set one breakpoint at the end of the sinewave loop (and saved the asm file with its breakpoint to avoid a possible crash while debugging). The loop time between two consecutive stops is 97 us (displayed below the editor).

Note:  Since Nbits per cycle (97 bits, here) is odd, the delta bit stream table from which the sinewave loop extracts the outputted bits consists of 2 cycles instead of one (it consists of 1 cycle when Nbits is even).

Doing the calculation, we get:
Sinewave Frequency = 1,000,000 / ( Tperiod us / 2 cycles) = 1,000,000 / (97 / 2) = 20,618.557 Hz
Sinewave Frequency = delta clock Hz / Nbits = 2,000,000 / 97 = 20618.557 Hz

So, while the actual frequency is 20.62 kHz, the O-scope displays 20.41 kHz.
Attachments
Adding or Removing Breakpoints (AVRasm2) may Freeze or Crash the Program AttachmentEarTest_08P1.zip
You don't have permission to download attachments.
(31 Kb) Downloaded 0 times
Adding or Removing Breakpoints (AVRasm2) may Freeze or Crash the Program AttachmentEarTest_08P1_list.zip
You don't have permission to download attachments.
(44 Kb) Downloaded 0 times

KerimF

KerimF


Does this happen only in Revision 1861?
I am not sure. I will have a look to be precise.
If I remember well, SimulIDE-R1677_Win32 seemed good.
But SimulIDE-R1709_Win32, SimulIDE-R1741_Win32 and SimulIDE-R1751_Win32 were not.


Does it happen at the moment you add/remove the breakpoint?
It does sometimes.


If not, when? doing a debug step? doing a "run to next breakpoint"?
Do you mean you run the code and no crash happened on your side while playing with breakpoints?
Again, I am not sure now. The crash likely happened when running the debugger after a pause.


Not sure, but this could be an issue:
These C-style comments will cause problems if they are meant to disable code.
Code:
/* ; <comment for Simu_1>
; 1 sec boot delay
    RCALL DLYqSec
    RCALL DLYqSec
    RCALL DLYqSec
    RCALL DLYqSec
*/ ; <comment for Simu_1>
I use a lot of /* and */ to avoid conditional compiling. So far, simulIDE didn't complain, in any way, about such commented blocks when debugging other codes.

But, I can re-test the actual code after removing such blocks completely.

arcachofo

arcachofo

KerimF wrote:I use a lot of /* and */ to avoid conditional compiling. So far, simulIDE didn't complain, in any way, about such commented blocks when debugging other codes.
Those are not standard asm comments, so it is the same issue as conditional compiling: SimulIDE will not complain, it just will take it as normal code.
So it can work sometimes or it can fail, same exact issue than conditional compiling.

KerimF wrote:Do you mean you run the code and no crash happened on your side while playing with breakpoints?
Did I say that I run the code and no crash happened on my side while playing with breakpoints?.

arcachofo

arcachofo

KerimF wrote:I use a lot of /* and */ to avoid conditional compiling. So far, simulIDE didn't complain, in any way, about such commented blocks when debugging other codes.
I had a look and at least in this case this is not the problem.
So it must be something else.
In any case I can't reproduce the issue.

KerimF

KerimF

arcachofo wrote:
KerimF wrote:I use a lot of /* and */ to avoid conditional compiling. So far, simulIDE didn't complain, in any way, about such commented blocks when debugging other codes.
I had a look and at least in this case this is not the problem.
So it must be something else.
In any case I can't reproduce the issue.

There is a new observation.

I renamed EarTest_08P1.asm to EarTest_08P2.asm.
To be on the safe side, I cleaned all blocks commented with /* and */.
I started the debugger.
I added a breakpoint at 'IJMP' instruction; at the loop end of the 2 cycles, the end of section CNhBt41: .
I run the debugger.
It stopped at the breakpoint.
I re-run it and it stopped again at the breakpoint.
But after I repeated this several times, the program crashed.

I reproduced this many times but the number of repeats before a crash is not constant. It could be a few repeats or up to 40 repeats before a crash to happen.

The same problem happened even if I saved the code and the breakpoint before running the debugger.


Added:
Please note that I repeated the above test using SimulIDE_1.0.1-R1386_Win32. The program didn't crash at all, no matter how many times I re-run the debugger.


Last edited by KerimF on Thu Sep 07, 2023 10:29 pm; edited 1 time in total

arcachofo

arcachofo

royqh1979
wrote:
codeeditor::addBreakpoint() has a debugger status check, but remBreakpoint() dosen't.
I think it should be a bug.
You are right. I will have a look.

KerimF

KerimF

Please note that I repeated the above test using SimulIDE_1.0.1-R1386_Win32. The program didn't crash at all, no matter how many times I re-run the debugger.

arcachofo

arcachofo

KerimF wrote:There is a new observation.

I renamed EarTest_08P1.asm to EarTest_08P2.asm.
To be on the safe side, I cleaned all blocks commented with /* and */.
I started the debugger.
I added a breakpoint at 'IJMP' instruction; at the loop end of the 2 cycles, the end of section CNhBt41: .
I run the debugger.
It stopped at the breakpoint.
I re-run it and it stopped again at the breakpoint.
But after I repeated this several times, the program crashed.

I reproduced this many times but the number of repeats before a crash is not constant. It could be a few repeats or up to 40 repeats before a crash to happen.

The same problem happened even if I saved the code and the breakpoint before running the debugger.
I can not make it crash, In Linux or Windows, even after much more that 100 times.

What I see is that after some point the program does not return to that part of the code.

KerimF

KerimF

arcachofo wrote:
I can not make it crash, In Linux or Windows, even after much more that 100 times.

What I see is that after some point the program does not return to that part of the code.

No problem.

I think I will have to use SimulIDE_1.0.1-R1386_Win32 to debug the code till it will be completed.

Then I will use SimulIDE-R1861_Win32 (or newer version) to run the code but without breakpoints. Yes, with it, the code runs properly and quickly (much faster than with any previous version) in synthesizing the 485 frequencies.

arcachofo likes this post

Sponsored content


Back to top  Message [Page 1 of 1]

Permissions in this forum:
You cannot reply to topics in this forum